Modernization with Eyes Open: How AIOps Turns Infra Data into a Modernization Roadmap
Blog From ‘Run to Fail’ to ‘Plan to Replace’: How AIOps Changes Asset Lifecycle Strategy Cut unplanned downtime by up
Software systems have come a long way. From simple setups to today’s complex, distributed environments, the landscape has shifted dramatically. This evolution means that getting a clear picture of what’s happening inside these systems has never been more critical—or more challenging.
Here’s a shocking statistic: 85% of organizations struggle to diagnose and resolve problems in their distributed systems because their monitoring is insufficient.
This is where observability comes in. Unlike traditional monitoring, which often gives you a narrow view through predefined metrics and alerts, observability offers a 360-degree perspective of your system’s behavior.
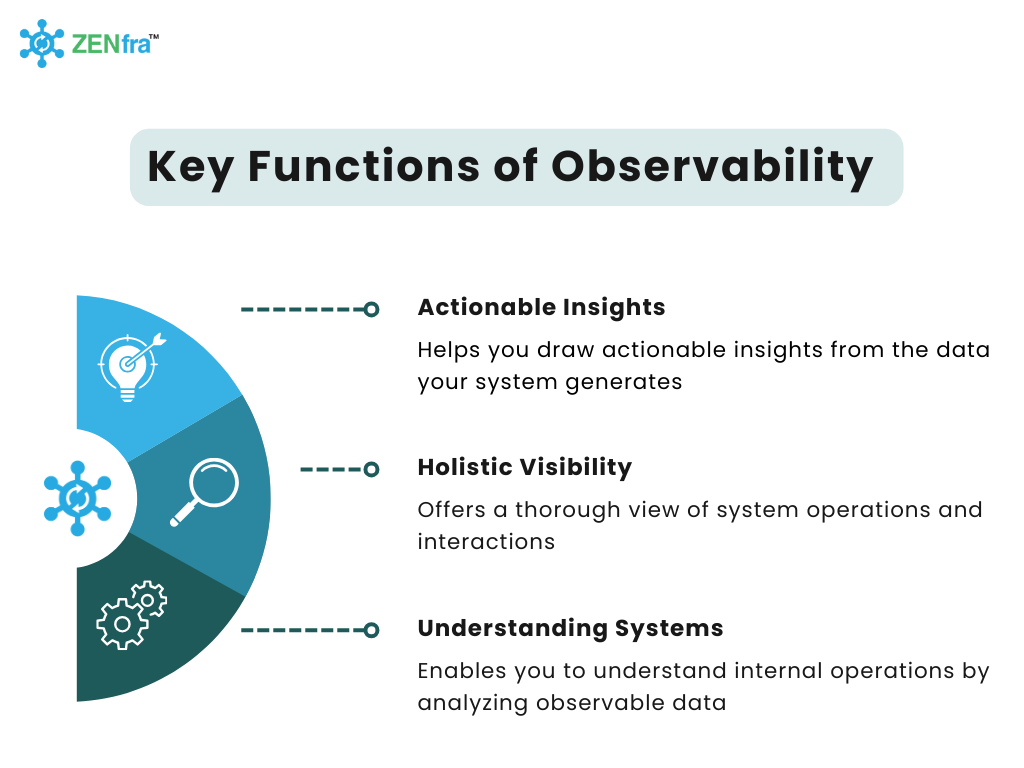
Think of observability as the key to unlocking a system’s internal state based on the data it churns out. It’s not just about seeing what’s happening; it’s about diving deep into the data to understand your system’s health and performance. Observability empowers you to figure out what’s going on inside your system by analyzing the data it generates.

Ready to simplify your IT management? Discover ZENfra zObs and take control today!
Let’s face it: modern software systems are complex. Moving from simple designs to intricate, distributed architectures brings several challenges:
Traditional monitoring tools often focus on specific metrics or logs. In dynamic, distributed environments, this approach can be limiting. Cloud-based observability tools solve this by integrating data from multiple sources for a more complete view.
It’s important to differentiate between visibility and observability:
| Visibility | Observability |
|---|---|
| This means seeing what’s happening within a system through specific metrics or logs—a snapshot of the system’s state. | This goes further, providing deeper insights into your system’s behavior by analyzing a wide range of data to understand internal states. |
In today’s world of microservices, where your applications are composed of countless interlinked services, observability isn’t just a luxury—it’s a necessity. Let’s dive into the key challenges and practical solutions that can help you master observability in a microservices environment.
Distributed systems come with complex component interactions. Observability is crucial because:
Overwhelmed by complexity? Download our FREE 25-point Observability Checklist to streamline your approach!
The 2023 Observability Forecast shows a surge in observability tool adoption. Here’s why:
Understanding observability means distinguishing it from traditional monitoring:
| Traditional Monitoring | Observability |
|---|---|
| Focuses on predefined metrics and alerts. While useful, it may not handle complex scenarios well due to static thresholds and siloed data. | Combines metrics, logs, events, and traces for a complete picture of system health. This approach allows for dynamic analysis, better data correlation, and faster issue resolution. |
Ready to elevate your system monitoring? Explore observability with ZENfra zObs for a deeper understanding of your system’s performance.
Building a solid observability strategy involves using fundamental components effectively:
AI and Machine Learning are revolutionizing observability. AI-driven features like automated anomaly detection and predictive analytics help identify and address issues before they affect the system. For example, AI can predict performance degradation or security threats, offering actionable insights to prevent problems.
Observability cloud platforms, such as zObs by ZENfra, provide scalable and flexible solutions. It offers a range of tools and features that help manage cloud observability, including advanced analytics, automation, inventory & resource utilization.
Unlock the full potential of your IT systems with ZENfra zObs. Discover the benefits of observability today!
Unlock the Full Potential of Your IT Systems with ZENfra zObs
Discover the benefits of observability today!

Modernization with Eyes Open: How AIOps Turns Infra Data into a Modernization Roadmap
Blog From ‘Run to Fail’ to ‘Plan to Replace’: How AIOps Changes Asset Lifecycle Strategy Cut unplanned downtime by up

Cut unplanned downtime by up to 45% – see how AIOps turns asset failures into planned decisions.
Blog From ‘Run to Fail’ to ‘Plan to Replace’: How AIOps Changes Asset Lifecycle Strategy Cut unplanned downtime by up

10 Ways Enterprises Build Cyber Resilience in 2026 – Beyond Backup
Blog Migration Chaos or Migration Clarity? The Choice Is Yours. Learn how ZENmig transforms complex moves into predictable, risk-free transitions.
5000 Quorum Drive
| Suite 710 | Dallas, TX 75254